Filter
82
Featured
41
5
7
Topics
28
13
12
10
10
8
8
7
7
7
6
5
4
4
4
4
4
4
4
4
4
3
3
3
3
3
3
3
3
3
3
2
2
2
2
2
2
2
2
2
2
2
2
2
2
2
2
2
2
2
2
1
1
1
1
1
1
1
1
1
1
1
1
1
1
1
1
1
1
1
1
1
1
1
1
1
1
1
1
1
1
1
1
1
1
1
1
1
1
1
1
1
1
1
1
1
1
1
1
1
1
1
1
1
1
1
1
1
1
1
1
1
1
1
1
1
1
1
1
1
1
1
1
1
1
1
1
1
1
1
1
1
1
1
1
1
1
1
1
1
Language
Document type
41
11
6
3
2
1
1
1
1
Countries
Authors & Publishers
Media focus
Publication Years
Methods applied
Journals
Output Type
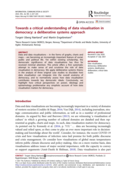
Towards a critical understanding of data visualisation in democracy: A deliberative systems approach
Information, Communication & Society, volume 26, issue 3 (2023), pp. 637-655
"Data and data visualisations – in the forms of graphs, charts and maps – are becoming an increasingly important feature of social, public and political life. Yet within existing scholarship, the democratic significance of data visualisations has thus far received minimal attention. This article
...
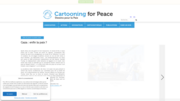
Cartooning for Peace = Dessins pour la Paix
Deep Insights
Paris: Cartooning for Peace (2023)
"Cartooning for Peace is an international network of committed press cartoonists who use humour to fight for respect for cultures and freedoms: 344 cartoonists in 78 countries [...]
Our values. Cartooning for Peace is attached to the respect for pluralism of cultures and opinions. In the events we
...
Seeing the (In)justice of Sustainability: Visualizing Inequality at the Centre of Climate Change Communication
Journal of Environmental Media, volume 3, issue 1 (2022), pp. 3-186

Bridging Journalism’s Data Viz Accessibility Gap
Oxford: Reuters Institute for the Study of Journalism (2022), 28 pp.
"Making a visual format accessible for people who can’t see is challenging, but there’s a huge community already invested in working out viable solutions. The tension that remains for them is in receiving a clear mandate for this work from senior leaders within organisations. Accessibility champ
...
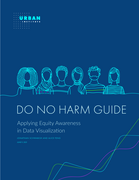
Do no Harm Guide: Applying Equity Awareness in Data Visualization
Washington, DC: Urban Institute (2021), 43 pp.

Biodiversity data as public environmental media: Citizen science projects, national databases and data visualizations
Journal of Environmental Media, volume 2, issue 1 (2021), pp. 79-99
"Through a combination of scientific and community activity, our environment is increasingly registered and documented as data. Given the expanding breadth of this digital domain, it is crucial that scholars consider the problems it presents as well as its affirmative potential. This article, arisin
...
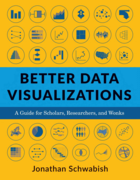
Better Data Visualizations: A Guide for Scholars, Researchers, and Wonks
New York: Columbia University Press (2021), xi, 449 pp.
"This book details essential strategies to create more effective data visualizations. Jonathan Schwabish walks readers through the steps of creating better graphs and how to move beyond simple line, bar, and pie charts. Through more than five hundred examples, he demonstrates the do's and don'ts of
...
Storytelling with Data: Let's Practice!
Hoboken, NJ: Wiley (2020), xvi, 427 pp.
"Each chapter starts with a brief recap of the key lessons that are covered in storytelling with data. This is followed by: 'practice with Cole': exercises based on real-world examples posed for you to consider and solve, accompanied by detailed step-by-step illustration and explanation; 'practice o
...
Data Visualization in Society
Deep Insights
Amsterdam: Amsterdam University Press (2020), 464 pp.
"This book is a contribution to the multi-disciplined and multi-faceted conversation concerning the forms, uses and roles of data visualization in society. Do data visualizations do 'good' or 'bad'? Do they promote understanding and engagement, or do they do ideological work, privileging certain vie
...
Producción de videos para la agricultura: Una guía para productores, técnicos e investigadores
PLAID Peer-to-Peer Learning (2019), 23 pp.
"En el proyecto PLAID se realizaron cursos de capacitación en vídeo para agricultores y consultores. Las experiencias obtenidas en estos cursos constituyen la base de esta guía. En ella se dan consejos sobre cómo producir vídeos informativos utilizando medios sencillos. Esta guía sigue los tre
...

Infographics, New Media and Media Consumption Habits in Nigeria
Oxford: Reuters Institute for the Study of Journalism (2019), 52 pp.
"This study engages in a comparative analysis of the history, importance, and benefits of infographics, in general, and in the media, in particular in Nigeria. It looks at the history of the Nigerian press, as well as the scale of use of infographics and new media tools in communicating business sto
...
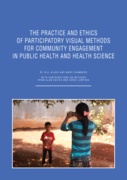
The Practice and Ethics of Participatory Visual Methods for Community Engagement in Public Health and Health Science
Key Guides
Cape Town: Livelihoods Foundation (2019), 116 pp.
"This handbook provides guidelines on the practice and ethics of participatory visual methods (PVM) with emphasis on their use in low and middle income countries (LMIC) for community and public engagement in health and health science. The guidelines are drawn from the hands-on experience of the auth
...
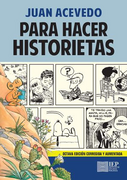
Para hacer historietas
Lima: Instituto de Estudios Peruanos (IEP), octava ed. corregida y aument. (2019), 309 pp.
"La primera edición de 'Para hacer historietas' es de 1978 y nació de la experiencia de los talleres que Juan Acevedo impartió en el entonces naciente Villa El Salvador. El libro alcanzó repercusión internacional gracias a sus ediciones españolas, alemanas y brasileñas. Agotado hace más de 2
...
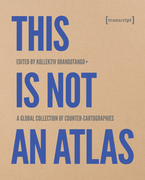
This is Not an Atlas: A Global Collection of Counter-Cartographies
Deep Insights
Bielefeld: transcript Verlag; Rosa-Luxemburg-Stiftung (2018), 352 pp.
"This Is Not an Atlas gathers more than 40 counter-cartographies from all over the world. This collection shows how maps are created and transformed as a part of political struggle, for critical research or in art and education: from indigenous territories in the Amazon to the anti-eviction movement
...
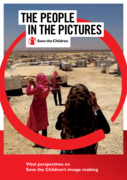
The People in the Pictures: Vital Perspectives on Save the Children’s Image Making. A Research Project to Understand How Contributors and Their Communities Experience and Perceive Save the Children’s Communications and its Image-Making Process
Deep Insights
Save the Children (2017), xi, 81 pp.
"Debates about the visual representations of global poverty have been going on for many years, yet the experiences and views of those featured have been notably absent. 'The People in the Pictures' addresses that gap. Save the Children commissioned research in the UK, Jordan, Bangladesh and Niger, t
...
Storytelling for Interactive Digital Media and Video Games
Boca Raton, Fl.: CRC Press, Taylor & Francis (2017), xv, 280 pp.
"This book is the perfect guide to aspiring storytellers as it illustrates the different manner of how and why stories are told, and how to make them "interactive." Storytelling features heavy game development as a method of storytelling and delivery, and how to develop compelling plots, characters,
...
Visual Thinking: Empowering People & Organizations Through Visual Collaboration
Amsterdam: BIS Publishers (2017), 144 pp.
"Visualizing thought processes can help break down complex problems. It empowers teams and staff to build on one another's ideas, fosters collaboration, jump-starts co-creation and boosts innovation. This book will help brush aside misconceptions that may have prevented you using these techniques in
...
PhotoVoice: Facilitator’s Guide
Rutgers (2016), 132 pp.
"PhotoVoice: A creative and effective tool for purposes such as monitoring, participatory research, data collection and capacity building. This guide has been developed to help you prepare, organise and facilitate a PhotoVoice training course in low, middle and high-income countries." (Back cover)
Data Visualizations Break Down Knowledge Barriers in Public Engagement
In: Civic Media: Technology, Design, Practice
Cambridge, Mass; London: MIT Press (2016), pp. 165-197