Filter
14
Breadcrumb:
Statistical Data
Featured
13
1
Topics
5
3
2
2
2
2
1
1
1
1
1
1
1
1
1
1
1
1
1
1
1
1
1
1
1
1
1
1
1
1
1
1
1
1
1
1
1
1
1
1
1
1
Language
Document type
2
2
1
1
Countries
Authors & Publishers
Media focus
Publication Years
Methods applied
Journals
Output Type
Measuring digital development: The affordability of ICT services 2024
Geneva: ITU (2025), iv, 27 pp.
"This edition’s findings highlight important progress: in 2024, mobile broadband services have become more affordable in most regions and for most income groups, and a growing number of countries are meeting the Broadband Commission’s target of entry-level broadband services costing less than 2
...
Are Donors Taking the Journalism Crisis Seriously? An Analysis of Official Aid to Media 2010–2019
Washington, DC: Center for International Media Assistance (CIMA) (2024), 32 pp.
"Donor agencies are saying that they are committed to media development and are trying to learn from the past but many of the same challenges that have beset the sector for years remain. And media support is still low on the list of aid priorities and can easily be cut when crises such as COVID‑19
...
Hispanic American Catholic Networks: Survey 2023
Rosario: Buena Nueva Comunicación (BNC) (2024), 26 pp.
"This survey aims to provide valuable information for the creation of potential initiatives and policies that promote, foster cooperation, and offer support to Catholic networks in Hispanic America. At BNC, we leverage our longstanding relationships with the personnel of these networks and the effec
...
The Mobile Gender Gap Report 2023
Deep Insights
"1. More women in low- and middle-income countries are using mobile internet than ever before, but their rate of adoption has slowed for the second year in a row. While 61% of women across these countries now use mobile internet, only 60 million women started using mobile internet in 2022 compared t
...
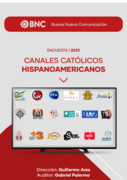
Canales Católicos Hispanoamericanos: Encuesta 2023
Rosario: Buena Nueva Comunicación (BNC) (2023), 26 pp.
"Esta encuesta se propone aportar información que sirva para generar posibles instancias y/o políticas de promoción, cooperación y apoyo en favor del trabajo de los canales católicos de Hispanoamérica, Desde BNC nos valemos de la relación de años que tenemos con el personal de los canales y
...
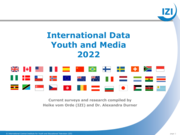
International Data Youth and Media 2022
München: Internationales Zentralinstitut für das Jugend- und Bildungsfernsehen (IZI) (2022), 109 pp.
"Presents media consumption data from European countries and the US, but includes also statistics on television, print media, mobile phone and social media usage of children and adolescents from Africa and Latin America." (commbox)
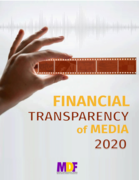
"The following report on the financial transparency of media represents data of 2020. In order to illustrate the extent to which budgetary funding influences the editorial policy of the media or to observe the types of editorial policies the concerned media outlets pursue, it also discusses some exa
...

An Analysis of Social Media Use in the SADC Region 2014 - 2020
Harare: Media Institute of Southern Africa (MISA); Konrad-Adenauer-Stiftung (KAS) (2020), 51 pp.
"I. Regional countries spend about 1.1 percent of GDP on digital investment, while advanced economies spend an average of 3.2 percent
II. 37% of social media users in the region have contributed to the creation of news, commented on it or shared it with others.
III. There is an upward trend in arres
...

Canaries in a coal-mine? What the killings of journalists tell us about future repression
Journal of Peace Research, volume 54, issue 2 (2017), pp. 157-174
"[...] To test the argument whether the killing of journalists is a precursor to increasing repression, we introduce a new global dataset on killings of journalists between 2002 and 2013 that uses three different sources that track such events across the world. The new data show that mostly local jo
...
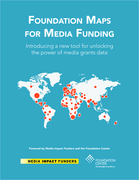
Foundation Maps for Media Funding: Introducing a New Tool for Unlocking the Power of Media Grants Data
Philadelphia: Media Impact Funders; Foundation Center (2016), 15 pp.
"Foundation Maps for Media Funding is a data mapping platform that brings the diverse and expansive field of media and philanthropy to light, allowing users to research and explore media and technology funding around the world. The tool captures activities related to media content and platforms; tel
...
"Over five years Facebook has grown from practically no users in Sub-Saharan Africa to become the most widely used social media platform. In the four countries where face-to-face surveys were carried out for this research, between 14% (Tanzania) and 27% (Ghana) of all respondents were using it [...]
...
Gender Assessment of ICT Access and Usage in Africa
Cape Town: Research ICT Africa; International Development Research Centre (IDRC) (2010), 39 pp.
"What is clear from the Research ICT Africa (RIA) Household and Individual Access and Usage Survey is that the diffusion of ICT is highly uneven concentrating in urban areas and leaving some rural areas almost untouched. Access to these technologies is constrained by income as is usage, and as they
...

World Information Society Report 2006
Geneva: ITU (2006), 151 pp.
"If the ambitious goal of building a global Information Society is to be realised, it is important to track progress against the indicative targets set out in the WSIS final outcome documents. One of the key elements is the bridging of the digital divide. This is a measure of the gap in access to IC
...
Media, Bureaucracies and Foreign Aid: A Comparative Analysis of the United States, the United Kingdom, Canada, France and Japan
New York: Palgrave Macmillan (2004), ix, 179 pp.
"In many ways, this book is a simple and straightforward product of social science research. A conceptual expectation was created through the integration and extension of existing theory and research findings. The responsiveness argument presented in chapter 2 lead to the expectation that aid bureau
...